

Today’s piece on The Players comes from Joe Peta, a former baseball writer turned golf author. In addition to writing baseball columns for ESPN from 2015-2017, Joe authored the Wall Street/sabermetric/sports betting memoir Trading Bases. Last year he put away the baseball spreadsheets and immersed himself in the world of PGA Tour data. The first product of that work, A 2019 Masters Preview, dropped last month (available on Amazon) and, thanks to a truly unique data set that had never been analyzed, contains never-before revealed analytics and insights on the Masters. As our guest author below, Joe takes a data-driven look at TPC Sawgrass and the unique nature of results at The Players.
Whether the memory is “Be the right club, today!” or “Better than most . . . . better than most!” or Rickie Fowler making birdie three times in one day on the 17th green—the same green where the legend of Tiger Woods began, in short pants and a straw hat—I love watching golf at TPC Sawgrass.
When it comes to handicapping and analyzing the performance of PGA Tour golfers at the The Players Championship, however, I hate TPC Sawgrass. It’s a design that generates unpredictable results—so unpredictable, in fact, that they seem to be based in large part on luck.
First, let’s distinguish between luck and a random occurrence. If a golf hole required putting into a Plinko board from a couple of feet away, the golfer with the best score would be determined solely by luck. In fact, there would be so much luck involved, it would put an 18-handicap on equal footing with a PGA Tour member.
On the other hand, if a golf course consisted of nothing but 340-yard Par 4s, with turtleback greens and a 310-yard carry over water to reach the front of the putting surface, it should be obvious that only the most-skilled golfers in the world would even be qualified to step on the first tee. However, it should also be clear that, even among pros, there would be an enormous amount of randomness in the results. Such an unpredictable design might make for entertaining viewing, but it would be too random to reward specific skill sets, and success one year would have no predictive power for the next year.
That, in a nutshell, is TPC Sawgrass. Don’t take my word for it, though—let’s look at some data.
When Mike McDermott asked his girlfriend in Rounders, “Why do you think the same five guys make it to the final table of the World Series of Poker every single year?” he was implying that repeatability is the hallmark trait of an endeavor of skill vs. one of luck. Although it isn’t obvious, PGA Tour courses vary greatly in terms of skill repeatability. Knowing that can vastly change a handicapper’s week-to-week reliance on the course history of golfers entering an event. Yet, while there’s a ton of content each week that focuses on player history at a specific event, I’ve never seen anyone look at the topic through the lens of the course.
To capture that element of the equation, I have calculated the year-over-year correlation of Strokes Gained at a tournament for all PGA Tour golfers who played in the same event two consecutive years. In other words, I’m measuring the correlation of a golfer’s Strokes Gained in Year T to his Strokes Gained in the same event in Year T+1. Here are the results for some of the iconic courses on the PGA Tour, 2014-2018 and 2009-2018, respectively:
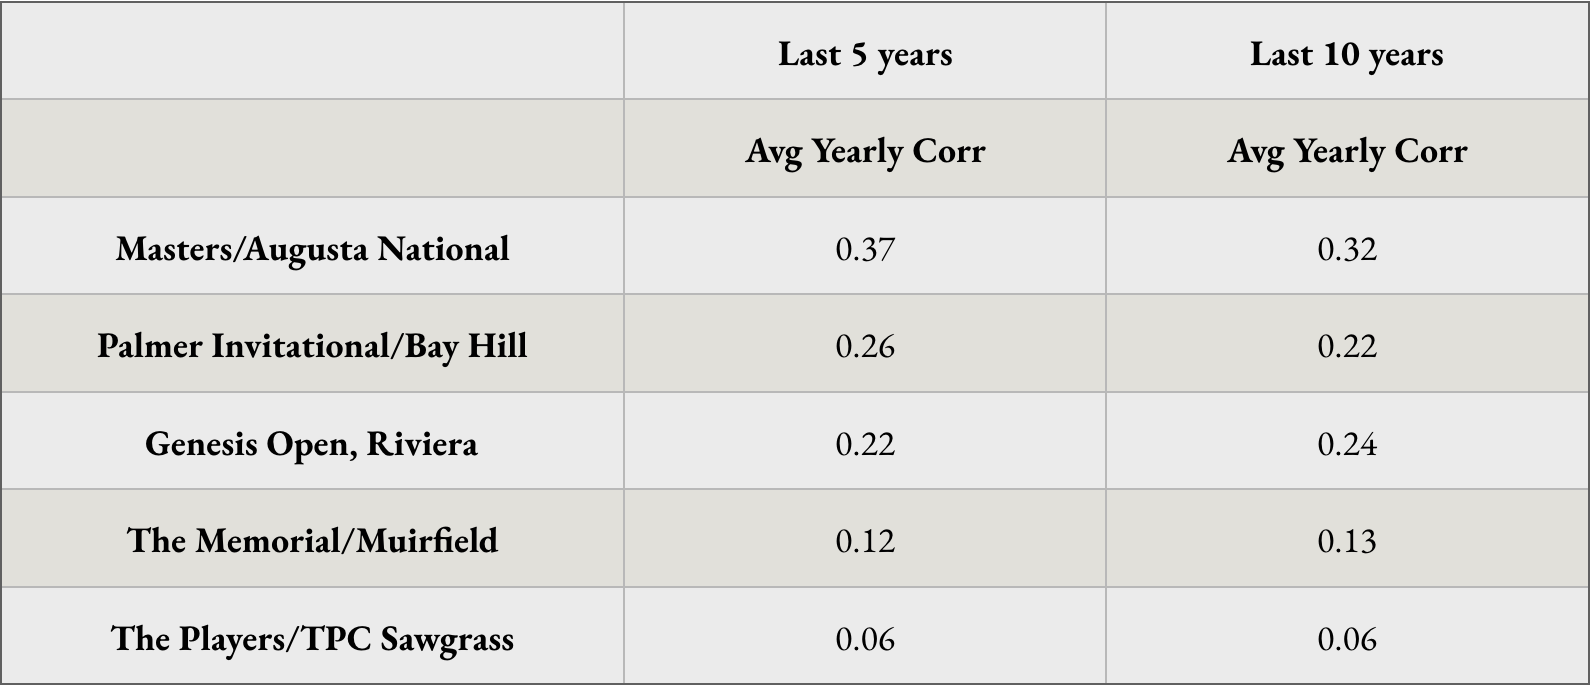
Across the entire PGA Tour, the average year-over-year correlation for all venues is about .16, so you can see that the more famous and prestigious courses on Tour generally have more consistency from year to year. Except, that is, for TPC Sawgrass, which has the least correlation, by far, of any course regularly played on Tour, not just those listed above.
In case there’s something strange in the course data, let’s take a look at the players themselves. The proper way to judge a specific golfer’s course factor isn’t to look at his history of finishes, money won, or cuts made, etc. Instead, look at a golfer’s Strokes Gained per round in the tournament over his baseline of performance, which I’ll define as his Strokes Gained per round in all tournaments he played that year. For example, in winning the event last year, Webb Simpson posted a total Strokes Gained of 15.10, or 3.78 SG per round. Over the entire 2018 season, he averaged 1.62 SG per round. Therefore, he had a positive course factor of 8.64 strokes over expectation ((3.78 – 1.62) * 4 rounds.)
I do that calculation for every golfer in every tournament. Looking at the results for The Players, it’s astounding how no golfers in this year’s field emerge as having accrued a significant amount of Strokes Gained over expectation, which would indicate a positive course factor – a ‘horse for the course,’ if you will.
In fact, here’s the most damning summary statistic: The entire field has a lifetime total of Strokes Gained over expectation of -1,011. In other words, 1,011 strokes below expectation! Most tournament totals hover around zero (because it’s a zero-sum calculation) or more commonly are mildly above zero, because of survivorship bias (i.e. golfers who have had poor performances, or those who are simply bottom-tier professional golfers and lose Tour status, don’t play in future events.) So what does a field with a huge deficit of Strokes Gained below expectation mean? It means that the guys with the positive strokes are PGA randos who are no longer on Tour.
Seventeen winners in the last 17 years at The Players, isn’t a feature, it’s a bug. And it’s why below-replacement golfers such as Craig Perks and Si Woo Kim are among those winners. For golf bettors and fantasy players, it’s frustrating but it does provide us with strong evidence to ignore a golfer’s history at the event when handicapping The Players Championship.
